
ACHIEVE OPERATIONAL EXCELLENCE IN MANUFACTURING
With Kure, all your teams can reduce defects and costs while increasing quality and productivity — without months of training, expensive consulting or confusing software.
Or book a demo

KURE FOR MANUFACTURING OPTIMIZATION:
Reduce Defective Parts
Here’s how Kure guides teams to optimize processes. In this example, a Process Optimization Team uses Kure to reduce the amount of defective parts produced in a key operation, resulting in:
Reduced material costs from scrap
Increased production volume
Customers receiving product on time and in full
56% Improvement in Rate of Defects
Step 1: What’s My Opportunity?
Clarify what optimizing the process will accomplish
A stainless steel parts manufacturer was experiencing an increase in defective parts for high-demand products, resulting in delays in delivery and shortages. Due to the bad product, operators were dealing with machine stoppages and a cluttered workspace. The operators teamed up with supervision and engineering to address the growing problem.
With Kure’s guidance, the team clarified the goal and organized the project. Kure automatically created a Project Charter, Plan and Timeline to guide the team through the optimization effort. The goal was to reduce the defective rate from 4.9% to 2.5%. This would save the company an estimated $480K per year.
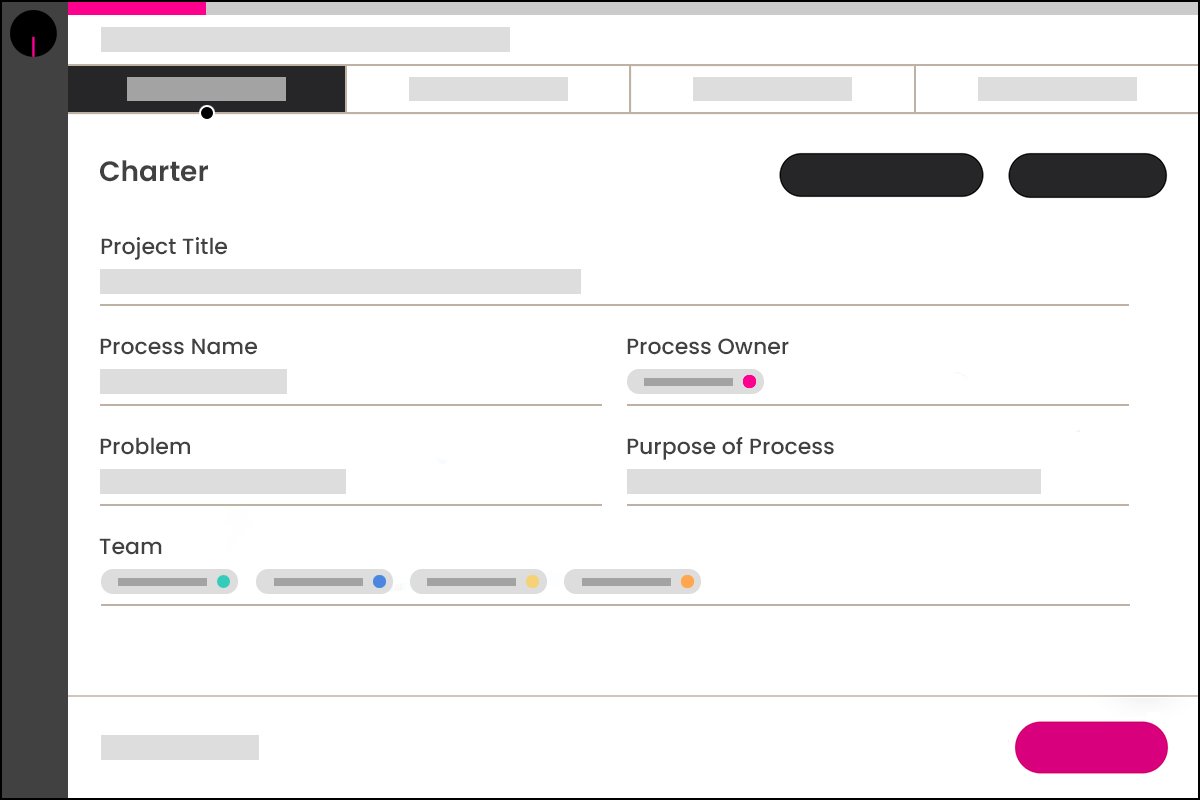
“The goal was to reduce the defective rate from 4.9% to 2.5%. This would save the company an estimated $480K per year.”
Step 2: What’s My Process?
Explore the steps by which the work gets done and find opportunities
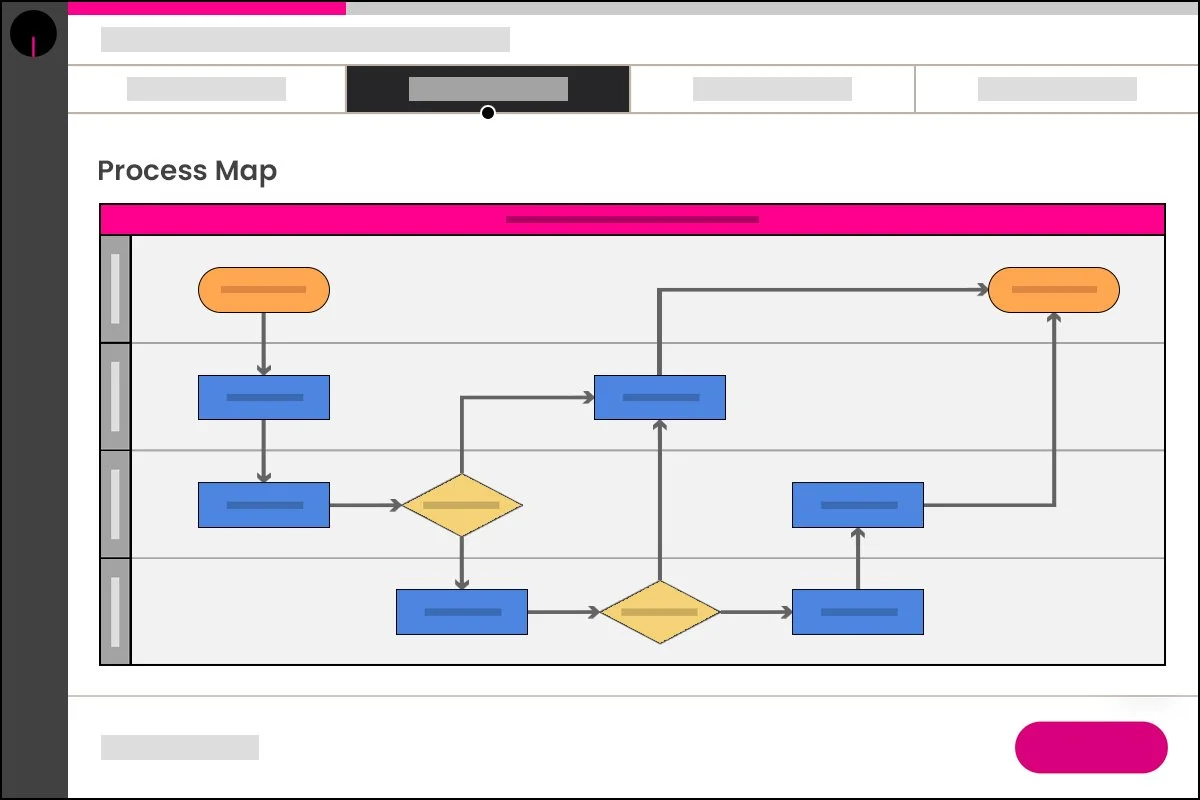
Kure’s As-Is Map and Data Collection Tools guided the team to map out the current process and collect data.
The Process Walk and Kure’s AI, which includes Anomaly Detection, helped uncover several clues, such as:
Variation in the machine set up prior to each run
Parts moving on machine during operation
Majority of defects isolated to same area of the part
Tools unavailable when needed
Step 3: What’s Causing My Problem?
Identify one or more actionable items producing the undesired effect
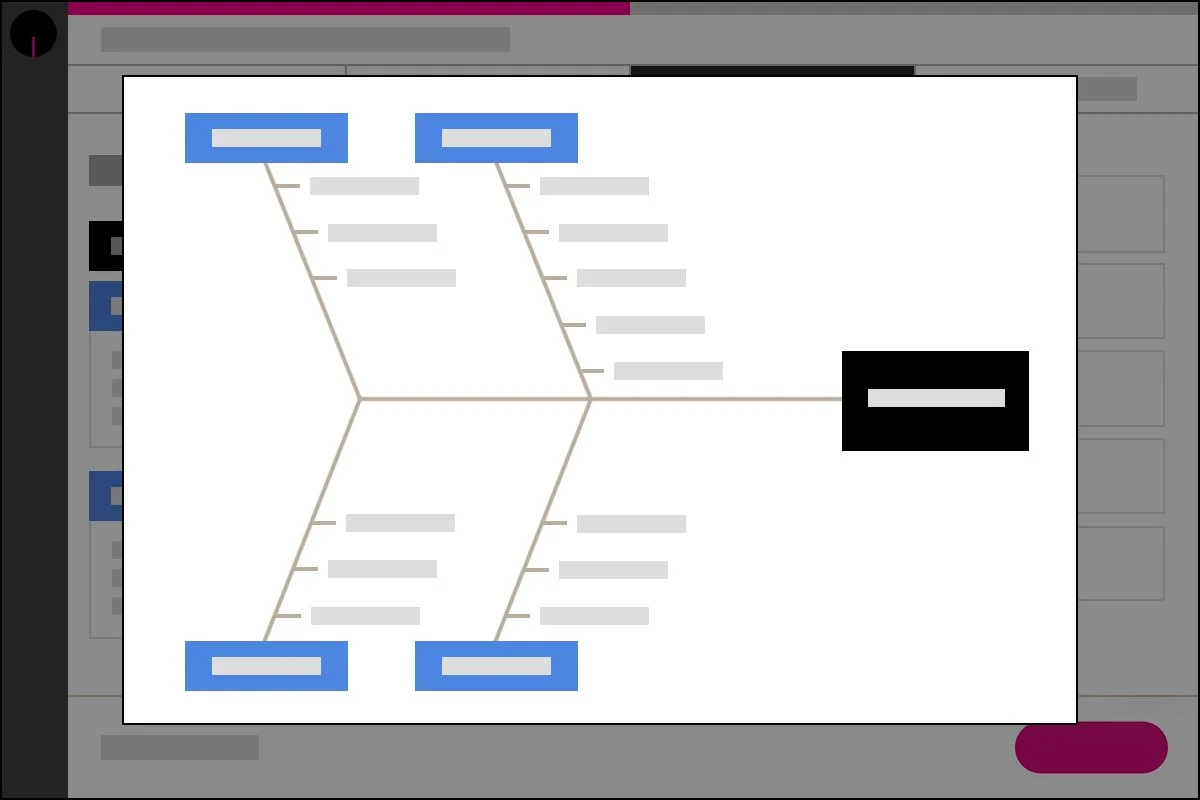
Using Kure’s Fishbone Diagram and the 5 Whys, the team identified several root causes to the problem including:
Unmarked controls used in machine setup
Worn and damaged machine chucks holding the part in place
Operators adjusting part position because of worn and damaged machine guides
Tools not stored properly after use
Step 4: What’s My Solution?
Implement specific solutions to make the problem go away
Focusing on these root causes, Kure’s Solution Selection Matrix and Implementation Plan helped the team identify and implement the best solutions.
Repaired machine tooling and guides and established a maintenance schedule
Established a set up and adjustment procedure along with clearly marking all adjustment controls
Implemented 5S to make the work area clean, organized and safe while ensuring all the necessary tools were readily available
Established cleaning and organizing procedure per shift
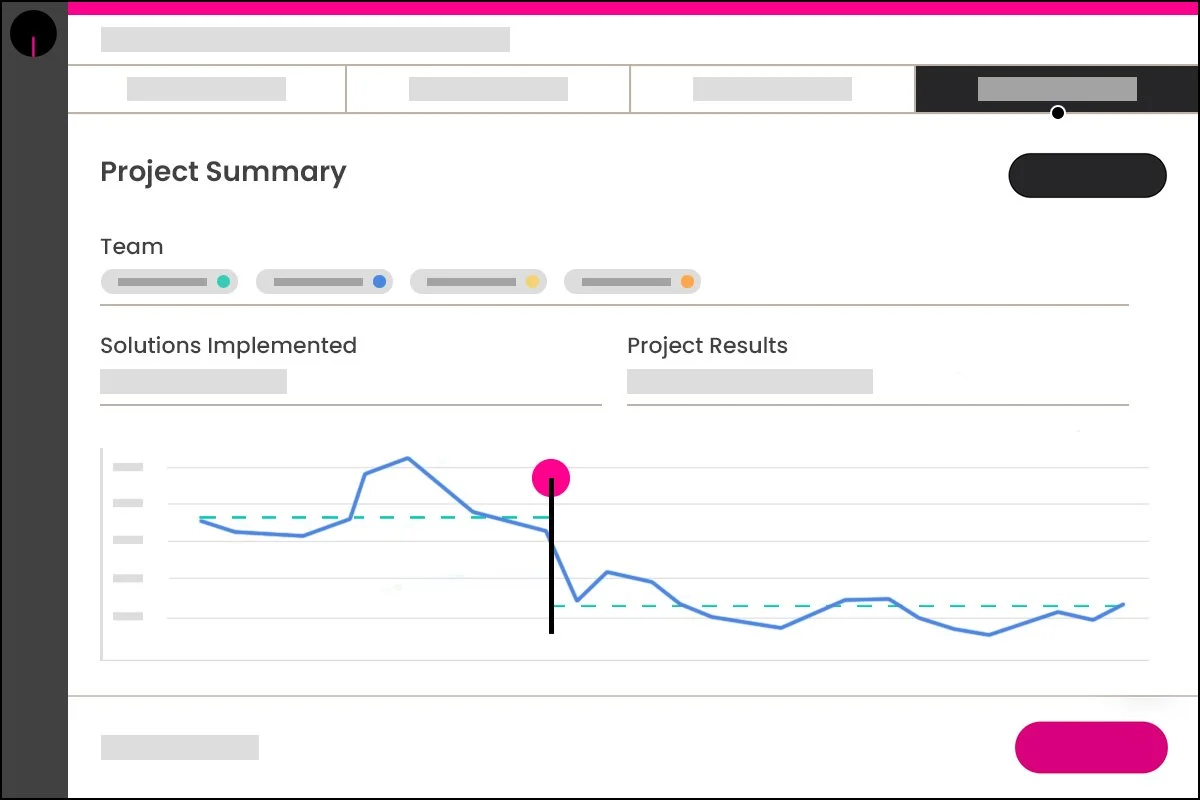
After implementing these solutions, the defective rate was reduced from 4.9% to 2.1% (56% improvement), exceeding the goals and saving the company over $560K per year.
Kure automatically generates this documentation alongside a Project Summary so the project team was able to easily communicate and celebrate their success — helping them efficiently transfer and scale their success to similar operations.
“After implementing these solutions, the defective rate was reduced from 4.9% to 2.1% (56% improvement), exceeding the goals and saving the company over $560K per year.”

“Guiding you every step of the way is what made Kure such a profound asset in optimizing my client’s inventory flow!”
— Billie P., Consultant, C&P Safety Group
“Kure is easy to use and very accessible. It makes you think differently and you start to see opportunities for improvement everywhere.”
— Rita M., Project Assistant, Wehr Constructors